Open Banking API Reliability: A Benchmark Framework for Fintech Buyers
Headline uptime figures say little about whether a payment completes at checkout. A framework for measuring open banking API reliability on the terms that actually drive operating cost.
In this research
Open banking API reliability sits at the heart of every account-to-account payment flow, yet most procurement conversations still centre on a single headline uptime figure. Uptime tells you almost nothing about whether a payment completes when a user is standing at checkout or funding an investment account at a busy moment. What a buyer actually needs is transaction completion under realistic conditions, measured on their own terms rather than a provider's marketing summary. This framework builds on CloudFintech's open banking explainer, which covers the underlying mechanics; this piece assumes that background and focuses on how to evaluate a provider once you understand how the connection works.
This framework gives fintech operators a structured way to specify and measure open banking API reliability across the dimensions that drive real operating cost: retry burden, partial failure handling, and the distribution of errors across the provider's bank network. It is written as a set of measurement criteria a buyer defines and requests during procurement: treat every dimension below as a test to run against a specific provider in your own pilot, not as a description of how providers in general report reliability, since that is exactly the assumption this framework asks you not to make. The worked example uses illustrative figures a buyer replaces with their own transaction profile.
Why headline uptime is not a reliability measure
Ask your specific provider what its published uptime figure actually measures before treating it as a reliability figure. If it is calculated from whether an endpoint returns a 2xx response to a health check, it measures infrastructure availability, not transactional reliability. A provider can report high uptime on that basis while carrying chronic problems with specific banks, timeout spikes under load, or inconsistent error semantics that force clients to treat every failure as ambiguous.
The disconnect matters because many production failures are partial rather than total: one major retail bank becomes intermittently unreachable for payment initiation while account information requests continue to work. The provider's status page shows green. Completion rate drops. Customers blame the fintech's app, not the bank, and the fintech carries the support cost.
Measuring what matters requires segmenting reliability by transaction type, counterparty bank, and time window defined against your own traffic pattern, not a generic assumption about when banking rails are busiest, since that varies by provider, bank mix and customer base. A provider with a strong network across challenger banks but weak connectivity to legacy cores will perform very differently depending on which banks your customers actually use. Tolerance for latency varies too: a payment at point of sale cannot wait for a retry, but a scheduled bill payment can absorb a delay of several minutes.
Open banking API reliability: a benchmark framework for fintech buyers
The framework below structures evaluation around four dimensions: transaction completion rate, error classification and actionability, retry economics, and failure concentration risk. Each is measurable from pilot data or contractual commitments, and each maps to a specific operating cost you will carry in production. Treat every specific figure below as something to request and verify against your own pilot, not as an industry benchmark to expect.
Transaction completion rate is the share of initiated requests that reach a terminal success state without client-side retry. This is the headline metric, but it must be segmented to be useful. Request completion rate by bank tier (your top retail banks by expected volume, separately from mid-tier and challenger cohorts), by transaction type (payment initiation vs account information vs confirmation of funds), and across your own busiest transaction windows rather than an assumed peak period: a provider's traffic pattern and yours will not necessarily coincide.
Error classification and actionability measures how often a failure tells you what to do next. Errors generally fall into three categories: definitive (payment refused, insufficient funds: do not retry), transient (timeout, rate limit: retry after backoff), and ambiguous (generic error, bank offline: state unknown). A specific status can itself be ambiguous in practice. The specification's status-of-payment proposition distinguishes settlement on the debtor's account from settlement on the creditor's account, but this is an optional implementation element, not something every integration is guaranteed to expose. Open Banking Standards, Status of Payment[1] Where a provider does surface only debtor-side settlement, that status confirms the payer's account has been debited, not that the payee's account has been credited; ask your provider explicitly which of these states its own integration actually returns. Ambiguous errors are expensive because you must either poll for status or escalate to support, and the customer sees a spinner. A provider whose error responses are frequently ambiguous is passing state-reconciliation cost on to you; ask for the actual split by error type from pilot data, rather than assuming a typical distribution.
Retry economics captures the cost of achieving acceptable completion once you account for retries. If first-attempt completion is low but transient errors are well-labelled and resolve quickly, a single automatic retry may be acceptable. If errors are ambiguous or retries frequently fail, you are building a complex state machine and carrying latency the user experiences as unreliability. Measure mean retries to success and the share of requests requiring manual intervention or customer contact.
Failure concentration risk measures whether failures are evenly distributed or concentrated in specific banks or times. A provider whose issues concentrate in two large banks that represent a big share of your volume carries a different risk than one with evenly distributed smaller issues. Request failure rate by bank, ranked by your expected transaction volume, and the share of total failed volume accounted for by the worst-performing decile of banks in your own mix.
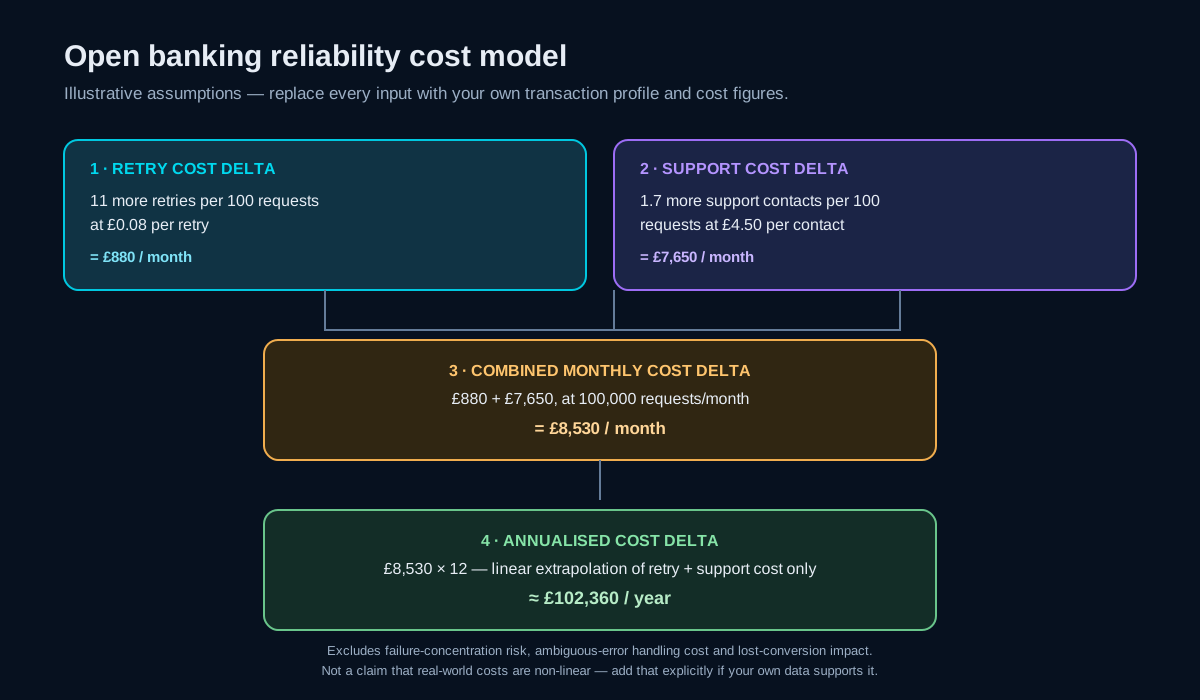
Methodology: CloudFintech derives the cost delta as: (retry-rate delta per 100 requests × cost per retry + support-escalation-rate delta per 100 requests × cost per support contact) × (monthly request volume ÷ 100); annualised cost = monthly cost delta × 12. All inputs are illustrative assumptions the reader replaces with their own transaction volume and cost figures. The model excludes failure-concentration risk, ambiguous-error handling cost and lost-conversion impact, and does not assert that real-world costs scale non-linearly with volume.
Primary sources: Open Banking Standard – API Specifications; Open Banking UK Read/Write API Profile, Status Codes and Idempotency; Open Banking Standards, Status of Payment
Download underlying datasetThe table below models the steady-state operating cost difference between two illustrative open banking providers, at a constant 100,000 payment initiation requests per month. This is not a first-year ramp calculation: it assumes the stated volume and reliability gap hold constant, then annualises the resulting monthly cost difference. The figures are not market data; they are a starting point you adapt to your own transaction profile, support cost structure and tolerance for latency.
| Dimension | Provider A | Provider B | What this row measures |
|---|---|---|---|
| First-attempt completion | 91% | 97% | A's first-attempt failure rate is 6 points higher than B's (descriptive only; see the retry row below for the cost-driving figure) |
| Share of errors ambiguous | 40% | 15% | A generates roughly 3.6 ambiguous states per 100 requests vs 0.45 for B |
| Mean retries to success (per 100 requests) | 15 | 4 | A requires 11 more retry attempts per 100 requests than B (the retry-cost driver below) |
| Requests requiring support escalation | 2.5% | 0.8% | A generates 1.7 more support contacts per 100 requests than B (the support-cost driver below) |
| Failure concentration (top 2 banks' share of failures) | 62% | 38% | Not priced in this model; a concentration risk rather than a per-transaction cost |
Assumptions: a constant 100,000 payment initiation requests per month (not a ramp: see the volume note below if your actual first-year traffic grows over time), an internal retry cost of £0.08 per attempt (engineer time, logging, infrastructure), and a support contact cost of £4.50 (tier-one agent time, escalation risk). The model prices only the retry and support-escalation rows above; it excludes failure-concentration risk, ambiguous-error handling cost and any lost-conversion impact, all of which would add further cost this figure does not capture.
The arithmetic, worked through: the retry delta (11 more retries per 100 requests, at £0.08 per retry, across 1,000 units of 100 requests at 100,000/month) costs approximately 11 × £0.08 × 1,000 = £880 more per month. The support-escalation delta (1.7 more contacts per 100 requests, at £4.50 per contact) costs approximately 1.7 × £4.50 × 1,000 = £7,650 more per month. Combined, that is approximately £8,530 more per month, or roughly £102,360 more per year at a steady 100,000 requests/month, before accounting for lost conversions or the reputational cost of failures this model does not price.
This is a linear extrapolation of two cost components only. It does not claim or assume costs scale non-linearly with volume. If your own experience shows support or engineering costs rise in step-changes past certain volume thresholds, add that explicitly with your own evidence rather than treat non-linearity as a given.
To adapt: replace the constant monthly volume with your own steady-state forecast, substitute your actual retry and support cost per unit, and re-weight failure concentration by your own volume distribution: a provider weak in one major bank is far more costly to you if that bank represents a large share of your flow than if it represents a small one. If your actual traffic ramps over the first year rather than starting at a constant volume, do not apply this annualised figure directly: recalculate the monthly cost delta at each month's actual volume and sum those figures, since the monthly cost scales with volume and a single annualised number calculated at the final month's volume will overstate a genuine first-year total.
What to request in the procurement process
Request segmented reliability data explicitly during technical diligence, rather than expecting a provider to volunteer it. Treat a provider that genuinely cannot produce it after being asked, versus one that has simply never been asked before, as two different signals. Request the following, ideally across a representative window that includes your own busiest and quietest periods.
First-attempt transaction completion rate, segmented by the banks that will represent the majority of your volume. If the provider cannot supply this, ask which banks consistently fall below their overall completion rate and by how much; this tells you where your risk is concentrated.
Error distribution: the share of failed requests by error type (definitive, transient, ambiguous) and the mean time to resolution for transient errors, measured from the provider's own data rather than assumed. A provider that resolves transient errors quickly is operationally different from one where transient errors require minute-scale retries; ask for the actual figure rather than accepting a qualitative assurance.
Retry and resolution rates: what share of initially failed requests succeed on first retry, second retry, or require manual intervention. This tells you whether the provider's infrastructure is self-healing or whether you are carrying the resolution cost.
Historical incident data: not a summarised uptime percentage, but a log of partial outages, degraded bank connectivity, and time to detect and communicate issues to clients. The speed and clarity of incident communication directly affects whether you can manage customer expectations during a degradation.
Contractual SLA terms: confirm explicitly whether the service-level agreement measures uptime or transaction completion; contract language varies by provider, so do not assume yours measures the outcome you care about until you have checked the actual definition. Also confirm whether it is segmented by bank or transaction type, and whether the remedy for breach is a credit or a termination right.
Failure modes worth testing for specifically
Three failure modes are worth testing for during a pilot, because none of them show up in an aggregated uptime metric and each can go unnoticed until a provider is already carrying material production volume.
The first is silent degradation: a bank's API begins rejecting a higher share of requests or returning ambiguous errors, but remains nominally reachable, so the provider's own monitoring does not flag it as an outage. Completion rate drops, the support queue fills, and the fintech discovers the issue from customer complaints rather than from the provider. Mitigating this requires client-side monitoring that tracks completion rate by bank and alerts on statistically significant deviations; you cannot rely on the aggregator alone to surface this.
The second is inconsistent error semantics across banks. Open banking API specifications define separate HTTP status codes and granular functional error codes for exactly this reason, and a payment resource's own status field (for example, whether it has reached a state confirming the payer's account was debited) is likewise specified in detail. Open Banking UK Read/Write API Profile, Status Codes[2] The specification defines the codes; it does not evidence how consistently individual banks implement them, so test that yourself rather than assume it. Request sample error responses from at least one representative bank in your expected coverage mix: one bank may return a clear "insufficient funds" definitive error, while another returns a generic failure that requires a separate balance check to disambiguate. A well-designed integration layer would normalise this for the client, but confirm it against real responses before relying on it in production, since the specification alone does not guarantee your integration layer handles every bank's variation correctly.
The third is latency spikes that exceed client timeout windows. A payment initiation request that completes in a few seconds on average may occasionally take much longer when a bank's core system is under load. If your client-side timeout is set without reference to the provider's actual worst-case latency, you may treat a slow-but-successful request as failed, retry it, and potentially double-submit. The specification's idempotency-key mechanism exists to prevent exactly this: for applicable endpoints, a repeated payment-initiation request carrying the same key must be treated as the original rather than a new submission for 24 hours, and the specification separately requires a minimum one-second delay before a client resends a duplicate request. Open Banking UK Read/Write API Profile, Idempotency[2] If your integration does not send that key correctly, the provider's logs will show the original request succeeded and you are now reconciling duplicates by hand. Ask the provider for P95 and P99 latency, not just the mean, and set your own timeout deliberately against those figures rather than defaulting to a round number.
Reliability as a negotiating variable
Confirm how your own provider actually prices its service, and separately, do not assume reliability is already an explicit contract term regardless of that pricing structure. Check, and if it is not, treat that as a starting point for negotiation. A provider that charges slightly more per transaction but delivers materially higher completion rates and clearer error semantics may cost less to run at scale than a cheaper one with worse reliability.
Negotiate SLAs that measure transaction completion rate, not only uptime, and that segment by bank or transaction type if your volume justifies it. Negotiate incident communication commitments: how quickly the provider will notify you of degraded connectivity to a major bank, and through what channel. Negotiate access to reliability dashboards that show completion rate by bank, rather than only an aggregated health check you cannot act on.
Where possible, negotiate termination rights tied to sustained reliability degradation, not just total outages. A provider that remains nominally available but whose completion rate falls materially is still failing to deliver the service you contracted for, and a credible exit right matters if they cannot remediate.
Building internal resilience around API dependency
Do not evaluate any provider against a standard of perfect reliability: verify instead what failure rate they can actually demonstrate from pilot data, and design your own architecture on the assumption that some failures will occur regardless of which provider you choose. The question to test for is not whether failures happen, but whether your architecture can absorb them without breaking customer experience.
That means client-side monitoring that tracks completion rate, error distribution and latency by bank and by time window, with alerts on deviations. It means retry logic that respects error semantics and avoids double-submission. It means graceful degradation: if a payment initiation fails ambiguously, can you fall back to card, queue the request for async processing, or communicate clearly to the customer what happened and when to retry?
It also means having a second provider under contract, even if only a small share of traffic is routed to them initially. If your own volume and technical capacity support it, a payment orchestration layer makes running a second provider a genuinely usable option rather than a theoretical one; see CloudFintech's embedded finance analysis for the related infrastructure. A demonstrated ability to move volume also gives you leverage in negotiation: it supports asking for a stronger incident-response commitment than a provider would grant a customer it knows cannot practically switch.
Open banking API reliability is not a binary feature you buy; it is a distribution of outcomes across banks, times and transaction types that you define, measure and design around yourself. The framework here gives you the questions to ask. What you do with the answers depends on how much operating cost and customer friction you are prepared to carry in exchange for a lower transaction fee.
Sources
Numbered references are anchored to the specific claims they support. Primary documents are preferred wherever available.
- Open Banking Standards, Status of Payment standards.openbanking.org.uk ↩
- Open Banking UK Read/Write API Profile, Status Codes openbankinguk.github.io ↩
Frequently asked questions
Is there a benchmark first-attempt completion rate fintech teams should expect from open banking providers?
Treat this as a buyer-defined test rather than a figure to benchmark against the industry: request each provider's own first-attempt completion rate segmented by bank and transaction type, measured from a pilot on your own traffic rather than their marketing material. Treat a provider's refusal to segment the figure as informative in itself.
How should fintech teams handle ambiguous errors from open banking APIs?
Ambiguous errors require either polling the provider for transaction status or escalating to support, both of which add latency and cost. Design your flow to communicate clearly to the user that state is uncertain, avoid double-submission through idempotency keys, and set a deliberate polling timeout before falling back to manual reconciliation.
Can fintech teams rely on open banking provider SLAs to manage reliability risk?
Do not assume your SLA measures transaction completion rather than uptime; contract language varies by provider, so confirm the actual defined metric before relying on it. Negotiate SLAs that measure the outcomes you care about, segmented by bank or transaction type where your volume justifies it, with incident communication commitments and remediation timelines for sustained degradation, not just service credits.
Is it practical for a fintech to use multiple open banking providers simultaneously?
Whether it is practical depends on your own volume and technical capacity: teams using a payment orchestration layer, or with transaction volumes that justify the integration overhead, are best placed to test it. Routing even a small share of traffic through a second provider gives you routing optionality during incidents and leverage in commercial negotiations, if your own infrastructure can support running two integrations at once.
Update history
- Corrected a worked-example arithmetic error (the stated cost difference is now derived transparently from its own line items), clarified the cost model as an annualised steady-state calculation rather than a first-year ramp figure, added claim-level citations to the Open Banking API specification at the exact claims about status codes, payment status and idempotency (independently re-verified against the live specification, including the exact 24-hour idempotency window and one-second minimum re